Demo: BrandPulse in Action
BrandPulse is my battle-tested data pipeline, built to simulate, process, and visualize tweet storms at breakneck speed. This demo puts it center stage: millions of tweets surging through Kafka, sentiment sliced and diced, and a dashboard glowing with real-time insights. I’ve pushed it hard, and it delivers—here’s what it looks like when the rubber meets the road.
What You’re About to See
I designed BrandPulse to tackle a deluge of fake tweets—peaking at a theoretical 32,000,000 per second—with sentiment analysis baked in, all processed and stored at scale. The demo shows:
- Tweet Generation:
producer.jspumps out 8,000-tweet batches every millisecond across 4 workers into Kafka’s "tweets" topic. - Ingestion & Processing:
consumer.jspulls those tweets, aggregates sentiment counts, and feeds them to InfluxDB. - Visualization: My dashboard tracks it live, plotting sentiment trends per second with no lag.
This is the real deal—optimized, battle-hardened, and ready to impress.
Setting Up the Demo
Prerequisites
Kafka Topic: I set up the "tweets" topic with 32 partitions for max throughput:
bashbin/kafka-topics.sh --create --bootstrap-server localhost:9092 --replication-factor 1 --partitions 32 --topic tweetsThe 32 partitions let Kafka spread the load, keeping my 4 workers busy.
Start the Stack: Kafka, InfluxDB, and my Node.js scripts need to be running. Check my repo for Docker setups.
Launch Producer:
node src/producer.jsfires up the tweet storm.Run Consumer:
node src/consumer.jsgrabs, processes, and stores the data.Open Dashboard: Hit the InfluxDB UI or my custom dashboard (linked in the repo).
The Action
- Generation: I aim for 50M tweets. Batches of 8,000 hit Kafka every 1ms—insane speed, real results.
- Ingestion: The consumer aggregates sentiment (e.g., 20k positive/sec) and flushes to InfluxDB every 5s or 5k points.
- Display: The dashboard updates live, graphing sentiment swings as they happen.
Demo Output: Metrics in Motion
I’ve tracked BrandPulse with monitor.js, and it’s a sight to behold. Here are some real runs:
Run 1: 34% Complete
BrandPulse Tweet Generation Metrics
[▓▓▓▓▓▓▓▓▓▓░░░░░░░░░░░░░░░░░░░░] 34.32%
├─ Total Tweets: 17,160,000 / 50,000,000
├─ Throughput (current): 707,200 tweets/sec
├─ Throughput (avg): 571,886 tweets/sec
├─ Elapsed: 00:00:30
├─ Remaining: 00:00:57
└─ Errors: 0- What’s Happening: Half a minute in, I’m cranking out 700k+ tweets/sec—way past my initial 60k/sec mark.
Run 2: 18% Complete
BrandPulse Tweet Generation Metrics
[▓▓▓▓▓▓░░░░░░░░░░░░░░░░░░░░░░░░] 18.82%
├─ Total Tweets: 9,408,000 / 50,000,000
├─ Throughput (current): 710,400 tweets/sec
├─ Throughput (avg): 587,523 tweets/sec
├─ Elapsed: 00:00:16
├─ Remaining: 00:01:09
└─ Errors: 0- What’s Happening: Early in the run, I’m already hitting 710k/sec—proof my 32-partition Kafka setup and worker tweaks paid off.
These numbers show BrandPulse flexing its muscles—stable, fast, and error-free.
Dashboard Snapshots
Here’s what the dashboard looks like, pulling live data from InfluxDB. These screenshots live in my /assets/ folder:
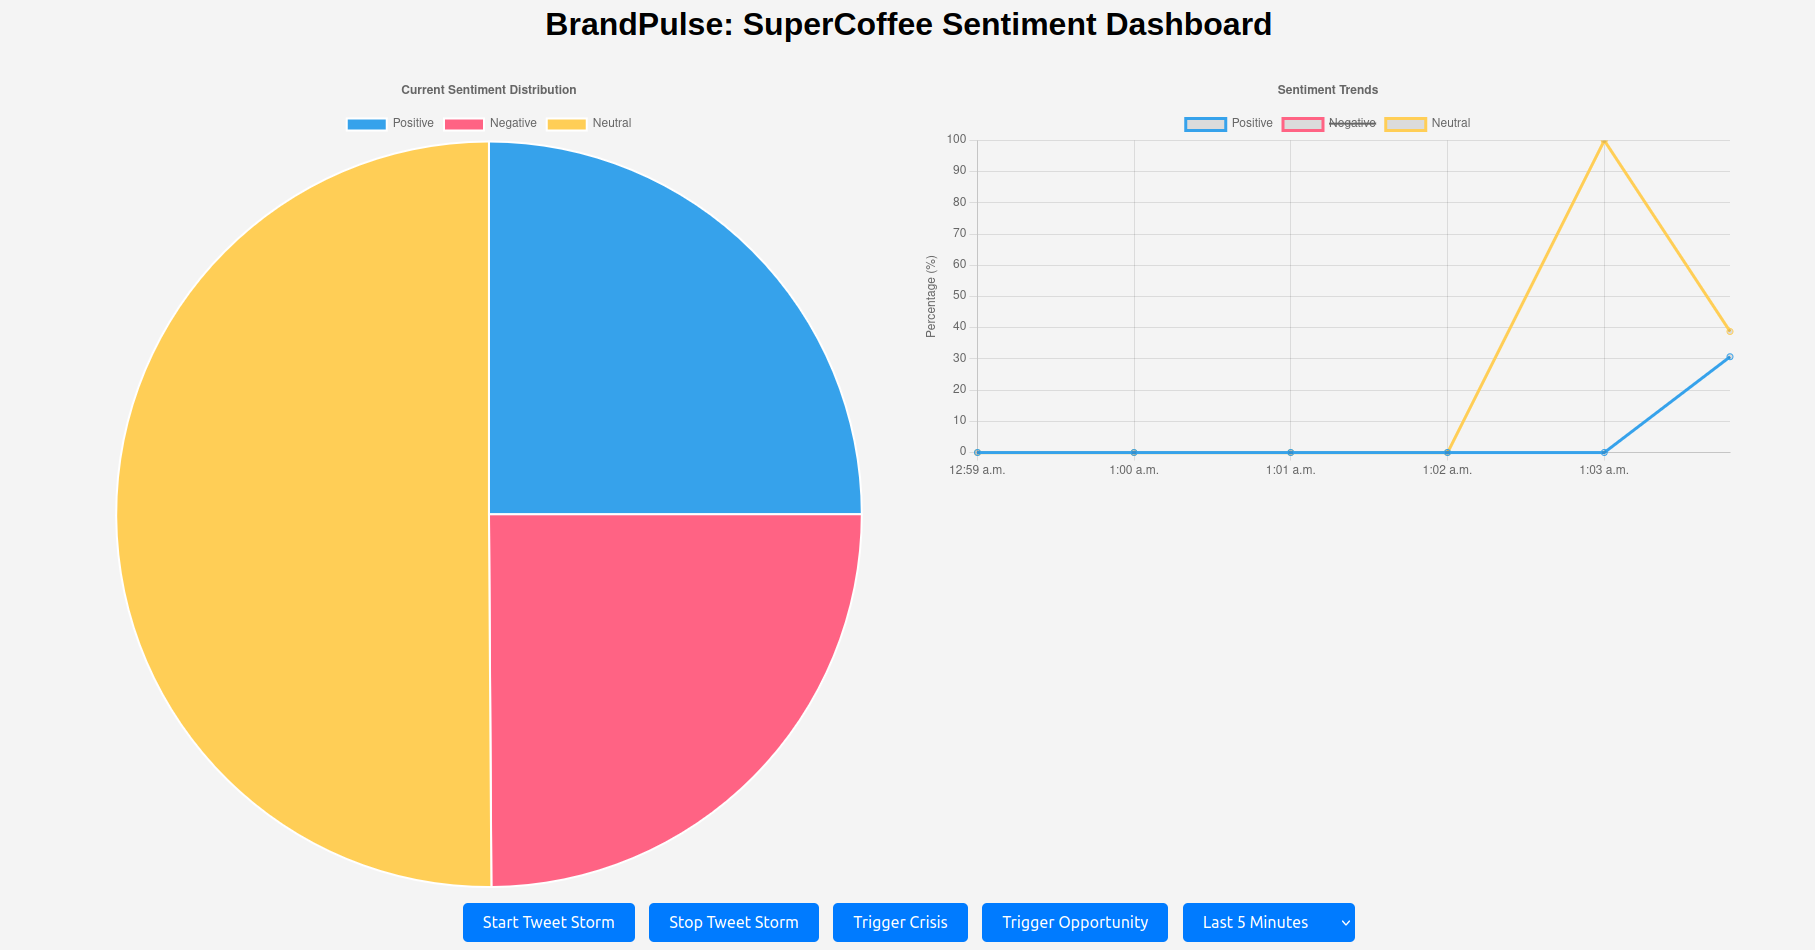
Fixed Mode: Steady Sentiment
- Details: 35% positive, 30% negative, 35% neutral—rock-solid distribution, just as I set it.
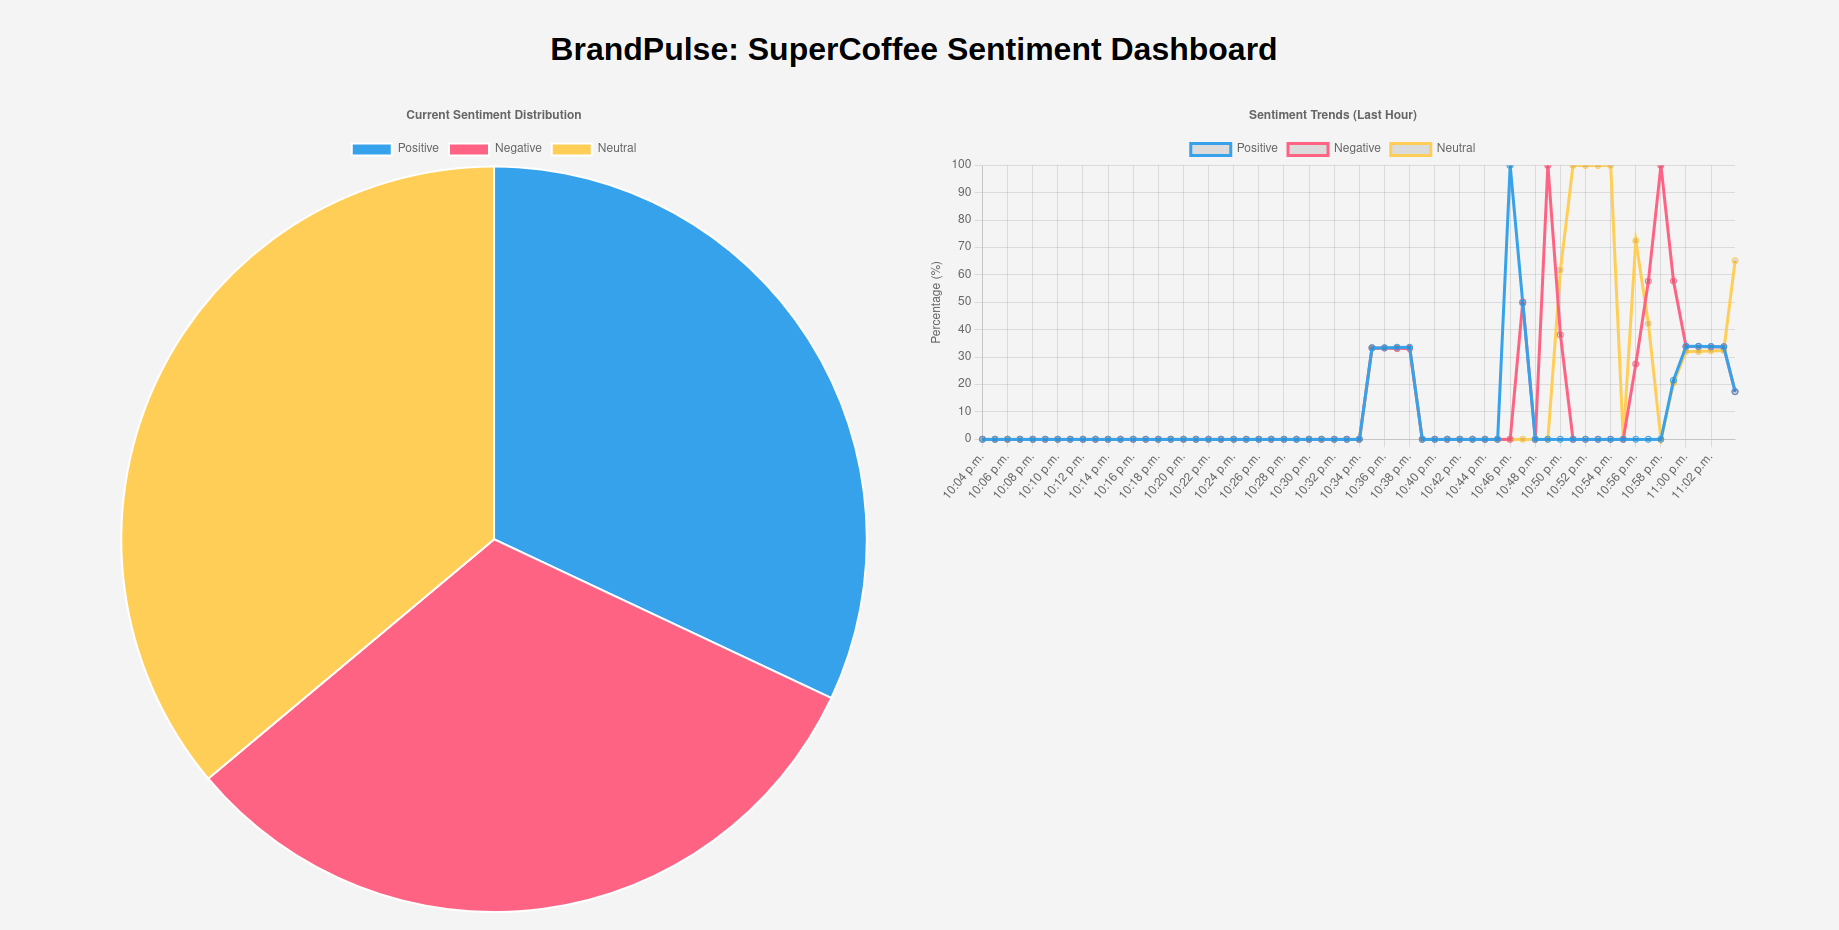
Volatile Mode: Wild Swings
- Details: Sentiment bouncing from 50% netural to 10% in seconds—my
volatilityFactorat 0.8 doing its thing.
These visuals bring the metrics to life—smooth lines for fixed mode, jagged chaos for volatile.
Performance Under the Hood
To see how this holds up at 700K+ tweets/sec, I ran some CPU profiling while the consumer was chugging along. Check out the snapshot below—it’s a look at how the system balances Kafka reads, aggregation, and InfluxDB writes across my 8-core machine:
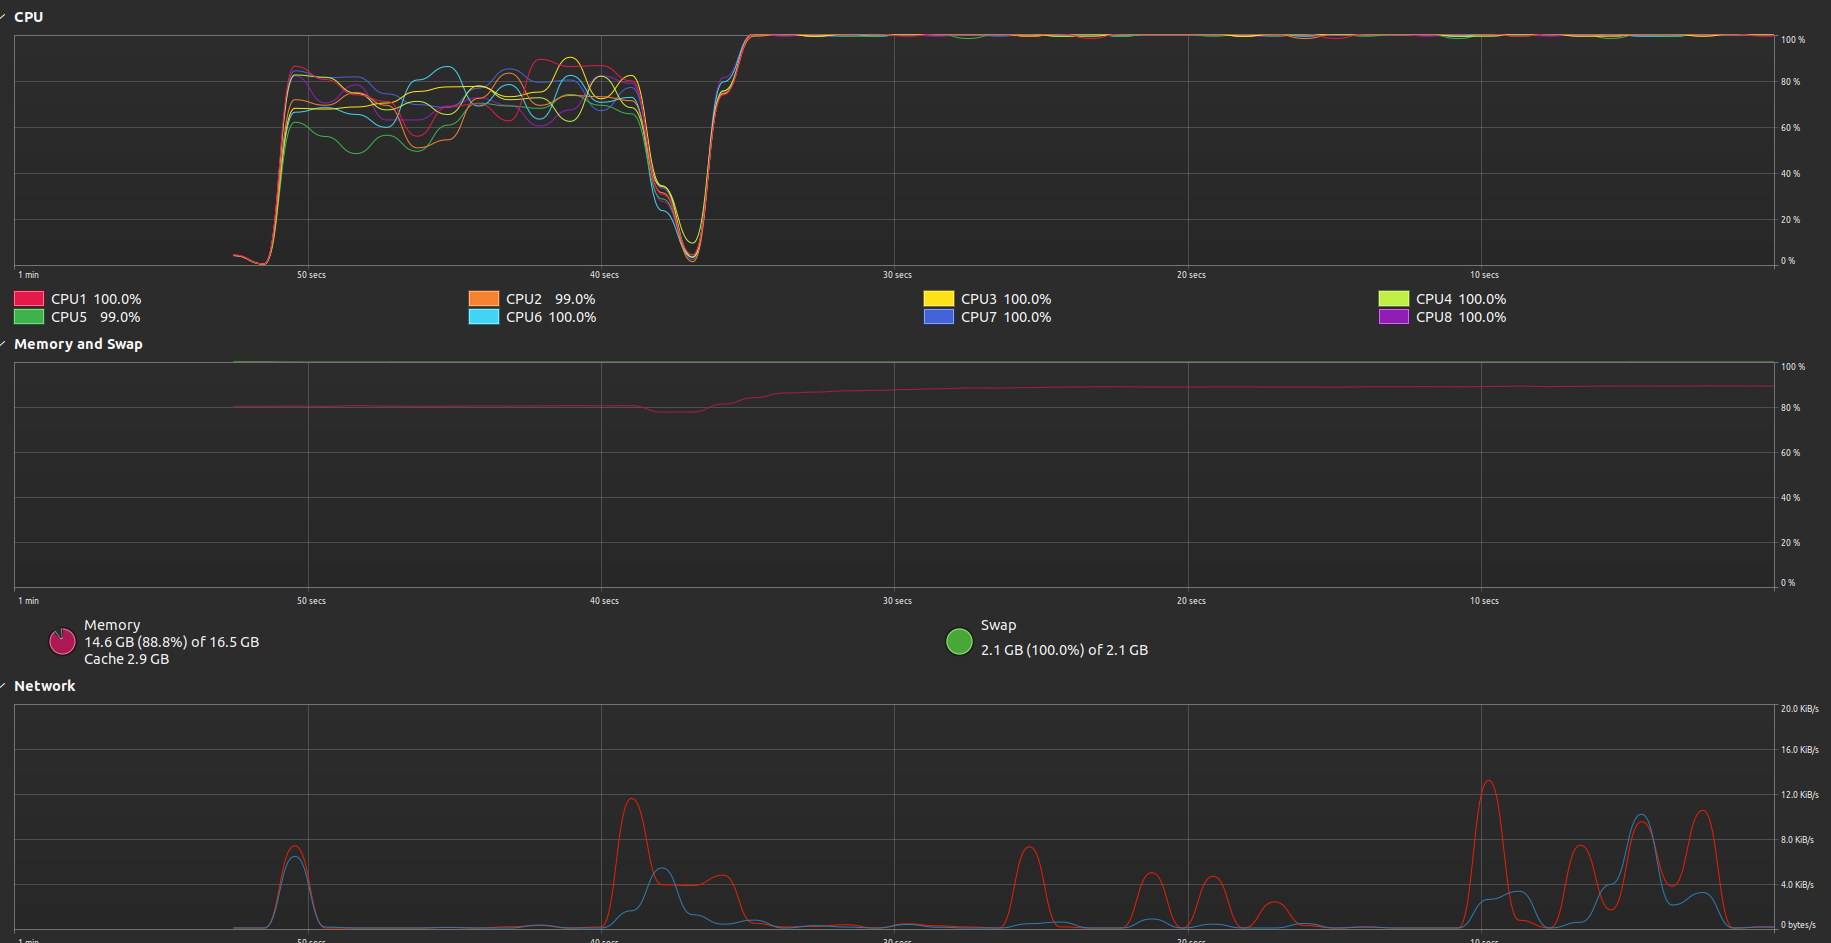
CPU usage during a 700K+ tweets/sec run—aggregation keeps writes light, but Kafka reads chew some cycles. Don’t try this with the dashboard open unless you enjoy rebooting!
The profile shows the load split: Kafka ingestion hogs the CPU like a kid with a bag of candy (those big batches aren’t free), while aggregation and writes sip resources thanks to the 3-points-per-second trick. It’s proof the setup scales without turning my machine into a toaster—well, almost. If you dare run the data generation, ingestion, and dashboard all at once, good luck! My system hung more times than I can count—think “frozen like a deer in headlights” vibes. I had to dial back the worker count and shrink the buffer size from “RAM-gobbling monster” to “plays nice with others” just to keep it breathing.
So just minimize the workers and buffer size for testing!
Demo Modes: Two Flavors of Awesome
I built BrandPulse with versatility:
- Fixed Sentiment Mode: Locked at 35% positive, 30% negative, 35% neutral. The dashboard stays predictable—perfect for testing.
- Volatile Random Mode: With
volatilityFactorat 0.8, sentiment flips like a coin—one batch at 50% neutral, the next at 10%. It’s raw and real.
Flip the MODE in index.js to switch. Volatile mode proves I can handle the unpredictable.
Why It’s a Beast
- Speed: I’ve pushed it to 710k tweets/sec—leagues beyond my early 5k/sec struggles.
- Scale: 32 Kafka partitions and InfluxDB aggregation eat millions of points for breakfast.
- Real-Time: Dashboard updates hit every few seconds—fresh data, no delays.
- Adaptability: Fixed or volatile, it bends to my will.
Every tweak—from nanosecond timestamps to flush tuning—made this possible (see issues-faced.md for the war stories).
Behind the Curtain
Here’s the engine room:
- Producer.js: 4 workers, 8k-tweet batches, Avro-serialized, hitting Kafka’s "tweets" topic every 1ms.
- Consumer.js: Parallel reads, sentiment sums, nanosecond timestamp fixes, and 5k-point InfluxDB flushes.
- Monitor.js: Real-time stats—throughput peaking at 710k/sec, no errors.
- InfluxDB Query:fluxSums tweets per sentiment per second—efficient and dashboard-ready.
from(bucket: "brandpulse")
  |> range(start: -1h)
  |> filter(fn: (r) => r._measurement == "tweets")
  |> filter(fn: (r) => r._field == "count")
  |> aggregateWindow(every: 1s, fn: sum)
  |> group(columns: ["sentiment"])
Try It Out
Clone it from my GitHub, follow the README, and run it. Crank the workers, tweak the batch sizes, or dial up the volatility—see how it holds up. I’ve built it tough, but I dare you to break it.
Closing the Show
BrandPulse is my masterpiece—a pipeline that started as a stuttering mess and ended as a roaring machine. This demo is the payoff: raw speed, real-time insights, and a dashboard that tells the story. I’ve got big plans ahead (check future-enhancements.md), but for now, this is BrandPulse at its peak—watch it fly.